Multiple Line Chart Widget
Multiple Line Chart Widget
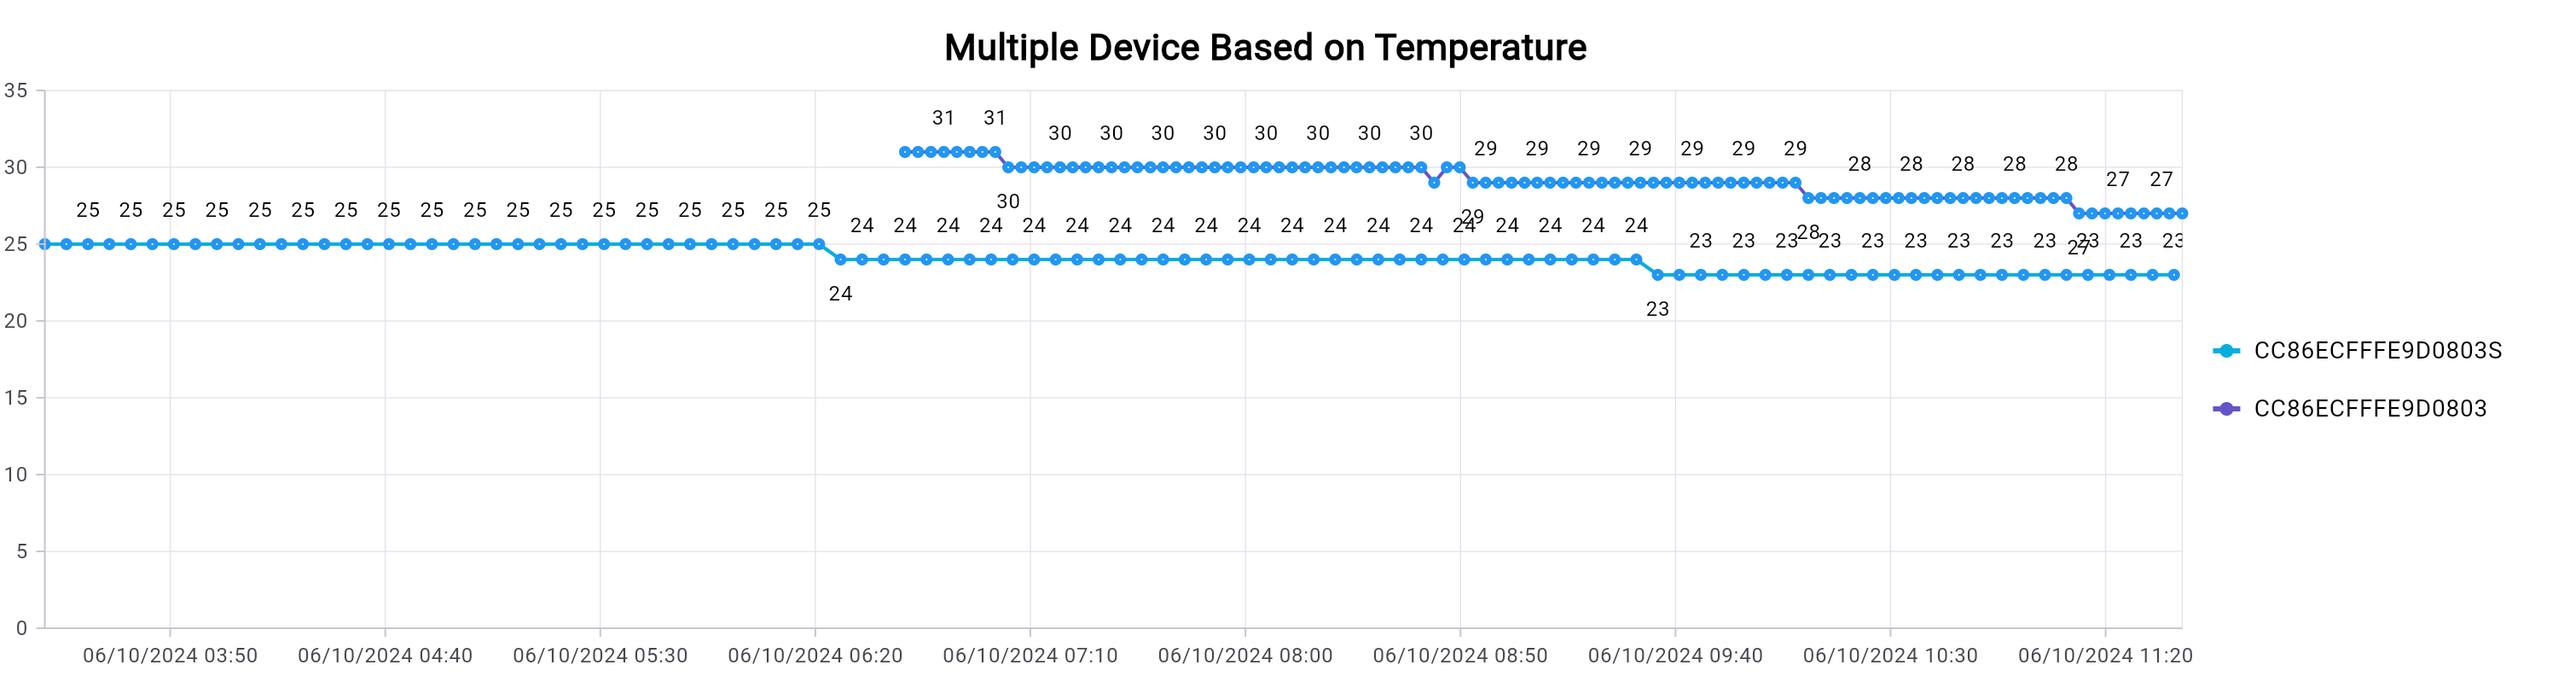
A multiple-line chart widget is a user interface component used to display and compare several sets of data over a continuous interval, such as time. This type of chart is particularly useful for visualizing trends, patterns, and correlations among multiple data series. By plotting multiple lines on the same chart, users can easily compare the performance or behavior of different metrics over a common axis.
Examples
Updated about 1 year ago
Worth Seeing
Did this page help you?